R(Visualise)--ggmap and baidumap
ggmap
ggmap可以轻松地从流行的在线地图服务(如Google Maps, OpenStreetMap,Stamen Maps)获得地图图块,并使用ggplot2绘制静态地图。
获取地图图块
get_map(location,zoom,scale,maptype,source,...) #主函数,返回ggmap对象 |
主要参数
- location:地址,经度/纬度对(按顺序)或 左/下/右/上经纬度边界框
- zoom = “auto”:地图大小
- scale = “auto”
- maptype:获取地形图,卫星图,路线图,混合图或其他地图
- source =c(“google”, “osm”, “stamen”, “cloudmade”):地图来源
- filename = “ggmapTemp”
- color = c(“color”, “bw”):color (“color”) or black-and-white (“bw”)
- language = “en-EN”:谷歌地图语言
- api_key:api_key for cloudmade maps
maptype参数: 获取地形图,卫星图,路线图,混合图或其他地图
from googlemap: terrain/terrain-background/ satellite/roadmap/hybrid
from stamen maps:terrain, “watercolor”, and “toner”
from cloudmade maps):integer (from function get_cloudmademap)
作图函数
ggmap(ggmap, extent = "panel", base_layer, maprange = FALSE, |
参数
- ggmap:用ggmap对象作图(from function
get_map) - extent = “panel”:地图细节(“normal”, “device”, or “panel”)
- base_layer:ggplot图层
- maprange = FALSE:与base_layer配合使用,定义x和y限制
- legend = “right”:
left/right/bottom/top/bottomleft/bottomright/topleft/topright
none(当extent="device"时使用) - padding = 0.02:距离 from legend to corner(和legend一起使用)
- darken = c(0, “black”)
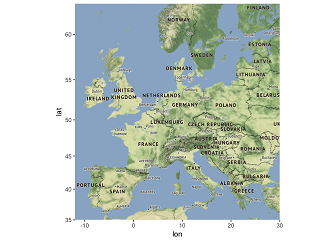
示例:一般作图
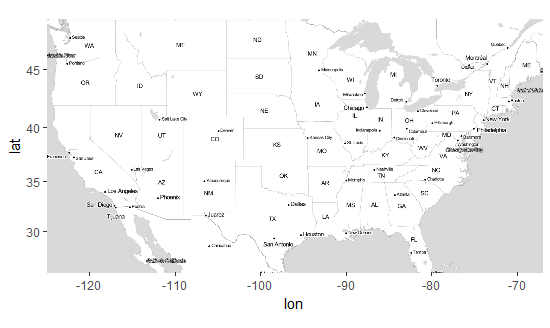
us <- c(left = -125, bottom = 25.75, right = -67, top = 49) |
示例:qmplot作图
library("dplyr") |
#刻面 |
经纬度信息
#返回经纬度信息(谷歌地图国内暂不能用) |
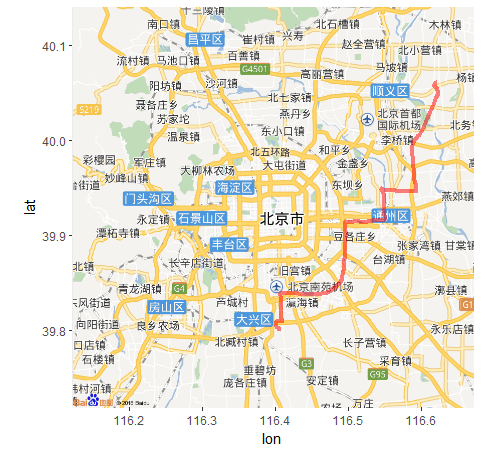
从Google Maps获取路线图
route(from, to, mode = c("driving", "walking", "bicycling", "transit"), |
使用Google Maps计算地图距离
mapdist(from, to, mode = c("driving", "walking", "bicycling"), |
Google认证
如果您拥有Google API密钥,则可以超出Google对查询的标准限制。
baidumap
为百度地图API提供R接口,和ggmap一样,但从百度api而不是谷歌或openstreet获取地图。
密钥
需要从 lbsyun.baidu.com申请密钥。然后在R注册你的钥匙。
library(baidumap) |
从坐标数据获取位置
getLocation(location,output = "json")
参数ouput: 设置返回数据类型(‘json’, ‘xml’)
lon = matrix(c(117.93780, 24.55730, 117.93291, 24.57745, 117.23530, 24.64210, 117.05890, 24.74860), byrow=T, ncol=2) |
从地址获取坐标数据
getCoordinate(address, city = NULL,output = "json",formatted = F) #返回坐标或初始信息
参数ouput:设置返回数据类型(‘json’, ‘xml’)
getCoordinate('北京大学', output='xml') # xml |
获取百度地图图块
getBaiduMap(location, width = 400, height = 400, zoom = 10, scale = 2, |
参数
- location:中心坐标或位置字符,
- width, height, zoom:图块大小
- scale:像素数的乘法因子
- color :color or “bw”,(color or black-and-white)
- messaging:提示信息
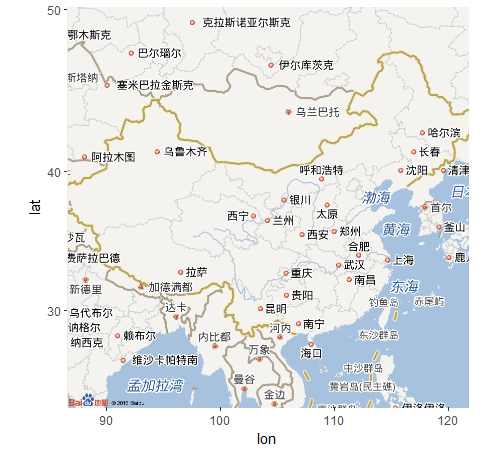
getBaiduMap('中国',zoom = 4) %>% ggmap |
搜索
getPlace(place = NULL, city = "北京", page_size = 20, pages = Inf, |
getRoute参数
- origin, destination:初始位置和目的地
- mode:出行方式,‘driving’(default), ‘walking’, or ‘transit’
- region:城市
- origin_region, destination_region:不在一个城市时,设置原始城市和目的地城市
>>> getPlace('麦当劳', '上海')%>%names |
百度地理编码
geoconv(geocode, from = 3, to = 5) 别的地理编码转化成百度地理编码
本博客所有文章除特别声明外,均采用 CC BY-NC-SA 4.0 许可协议。转载请注明来源 雷小小!
 Give me money!

相关推荐
2018-05-03
R(Visualise)--ggplot2
强大的绘图系统,并实现了许多扩展(Hadley)

2018-05-04
R(HTML Widgets)--leaflet
最流行的JavaScript库交互式地图之一,动态交互地图。

2018-06-01
R(HTML Widgets)--REmap
基于Echarts的简易动态交互地图

2018-05-29
R(Visualise)--ggforce(ggplot2 extensions)
饼图

2018-05-04
R(NLP)--jiebaR
R语言词云和中文词典包

2018-05-23
R(HTML Widgets)--shiny
使用R语言开发交互式web应用程序的工具
评论